
Serverless Sentiment Analysis for Hotel Customer Feedback
The Engineering Challenge: To replace a resource-heavy containerized prototype with a lean, scalable solution for processing guest feedback. The objective was to eliminate server management overhead while enabling real-time sentiment analysis and instant reporting for hotel management.
System Architecture & Implementation:
- Event-Driven Serverless Backend:
- Architected a purely serverless backend using AWS Lambda behind AWS API Gateway to handle CRUD operations, enforcing secure and throttled access.
- Pattern Implementation: Leveraged DynamoDB Streams to trigger asynchronous Lambda functions. This decoupled the data ingestion from the aggregation logic, ensuring the dashboard KPIs update instantly without blocking the user experience.
- Hybrid Cloud AI Integration:
- Integrated Google Cloud Natural Language API to process unstructured text immediately upon submission.
- Achieved a ~98% sentiment classification accuracy (Positive/Neutral/Negative) in benchmark testing, providing reliable automated triage for negative feedback.
- Visualization & Interface:
- Built a lightweight React frontend (Bootstrap CSS) for staff interaction and integrated Looker Studio for high-level visualization of sentiment trends.
Business Impact & Optimization:
- Cost & Ops Efficiency: The migration to a pay-per-use serverless model resulted in a ~50% reduction in infrastructure costs and management time compared to the previous container-based approach.
- Performance: The event-driven design improved data processing speed by ~30%, allowing for near real-time issue resolution.
Technologies Leveraged: Python, AWS Lambda, DynamoDB (Streams), API Gateway, Google Cloud NLP, React, Looker Studio.
Architecture Snapshot
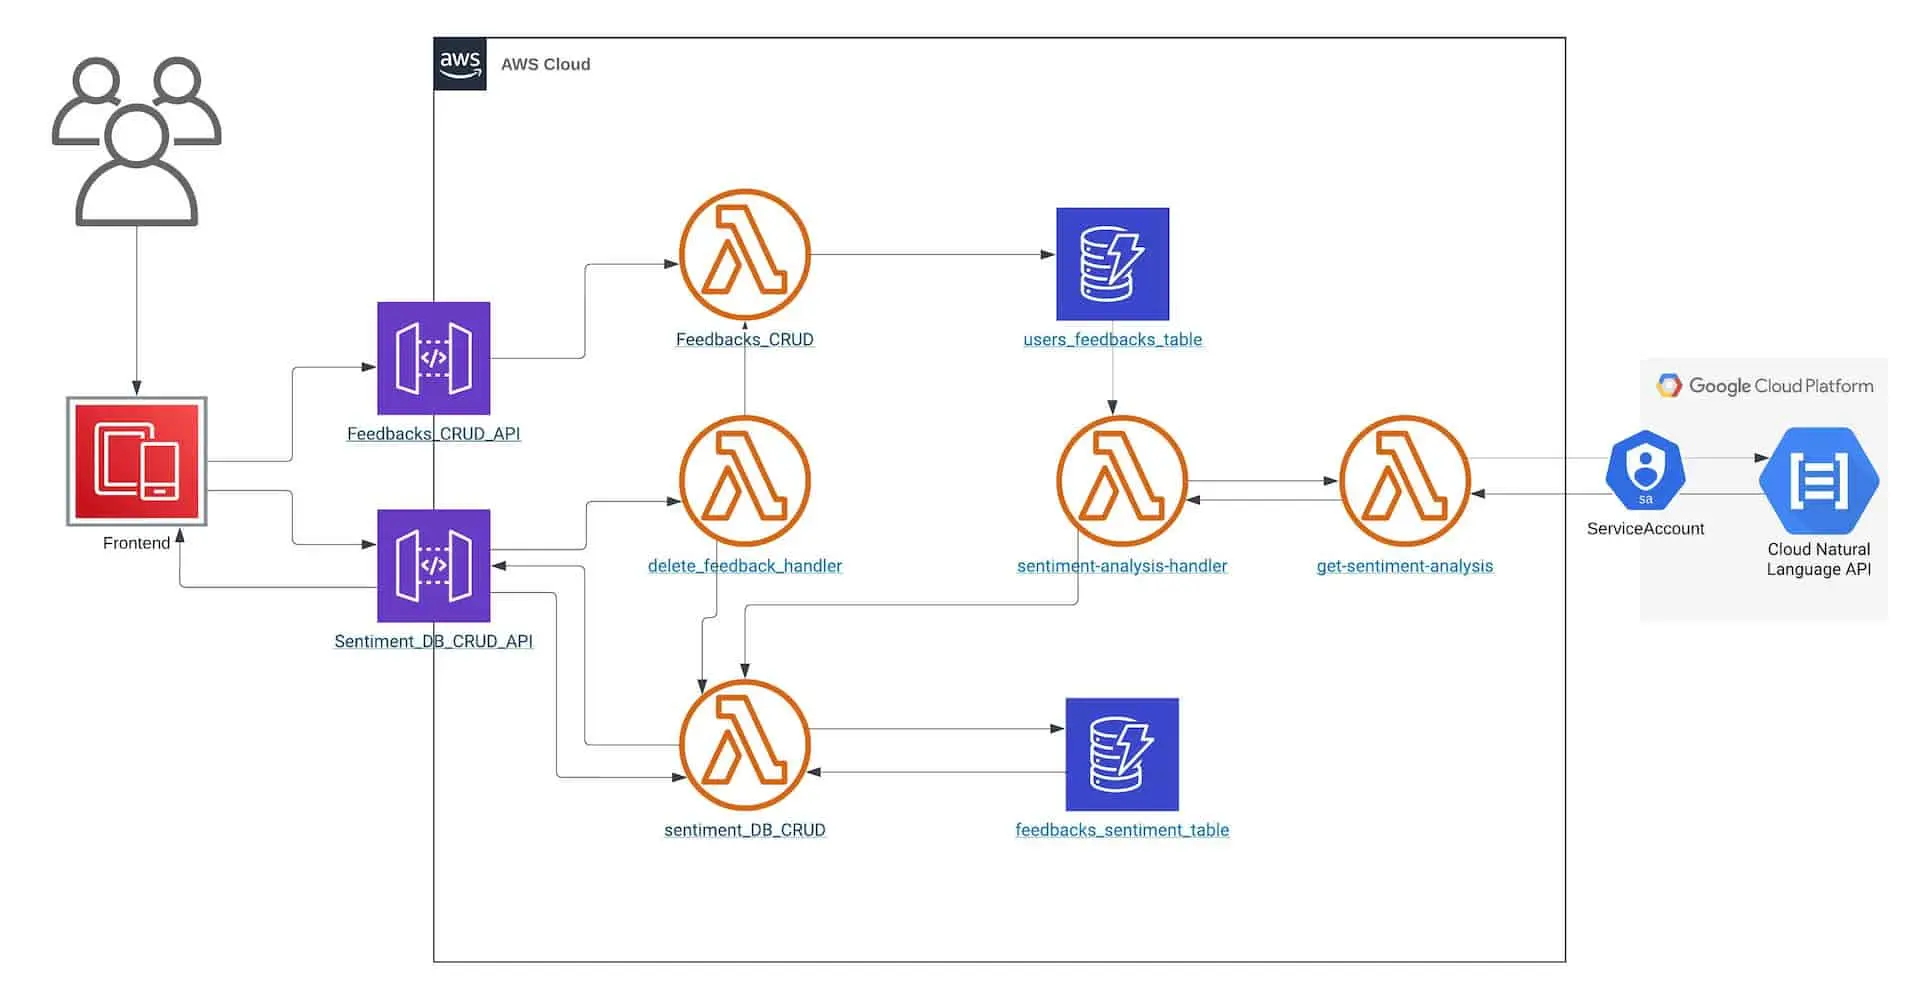
Figure 1: The event-driven pipeline: from raw user feedback to processed sentiment insights.
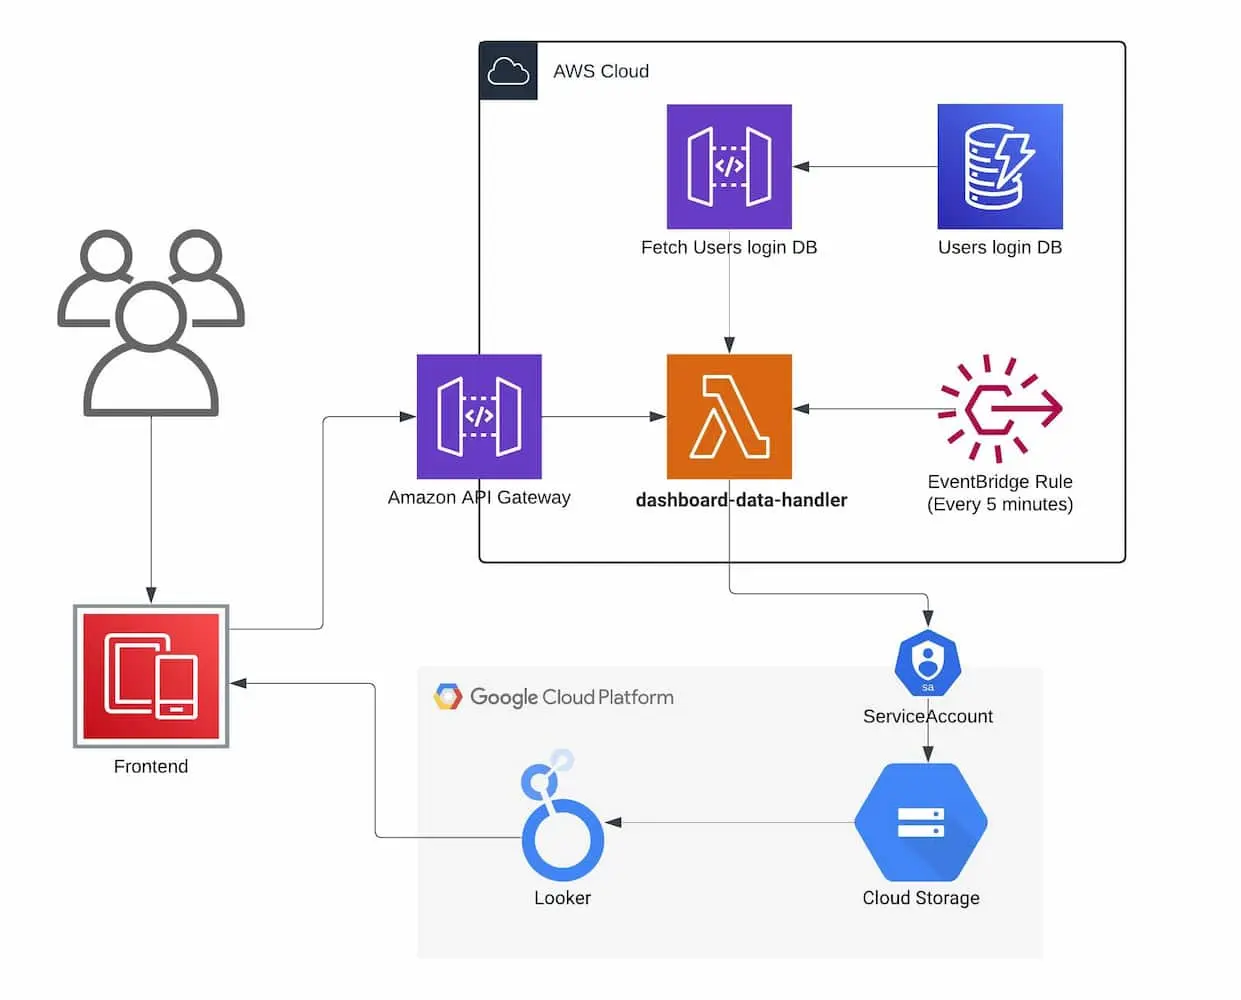
Figure 2: How processed data flows to the Looker Studio dashboard for visualization.