
Awarded Public Tenders Analysis Dashboard
The Engineering Challenge: Legacy procurement analysis relied on manual reviews of static spreadsheets, making it impossible to identify shifting purchasing priorities across a decade of data. The objective was to architect a scalable analytics tool that could ingest messy government data and surface hidden trends automatically.
Core Architecture & Implementation:
- Visual Analytics Engine: Built a reactive Single Page Application (SPA) using Python Dash and Plotly. This replaced static reporting with dynamic filtering (by buyer, supplier, contract value), enabling deep-dive granularity that was previously impossible.
- Unstructured Data Processing (NLP):
- Applied BERTopic to perform unsupervised topic modeling on 10 years of unstructured tender descriptions.
- This successfully clustered thousands of diverse contracts into coherent themes, visualizing how government spending priorities evolved year-over-year.
- Automated ETL Pipeline:
- Engineered a robust ETL script to parse, clean, and normalize disparate CSV/JSON exports from government portals.
- Impact: Reduced dataset noise by ~35% by handling missing values and standardizing vendor names, ensuring downstream accuracy.
- Configured daily automated refreshes to ensure the dashboard serves real-time decision support.
Business Impact:
- Operational Efficiency: Accelerated the identification of procurement trends by ~30%, eliminating hours of manual data crunching.
- Strategic Visibility: Transformed raw text into strategic intelligence, allowing analysts to visualize vendor concentration and spending anomalies instantly.
Technologies Leveraged: Python, Dash, Plotly, Pandas, BERTopic (NLP), scikit-learn, Docker, AWS EC2.
Dashboard Snapshot
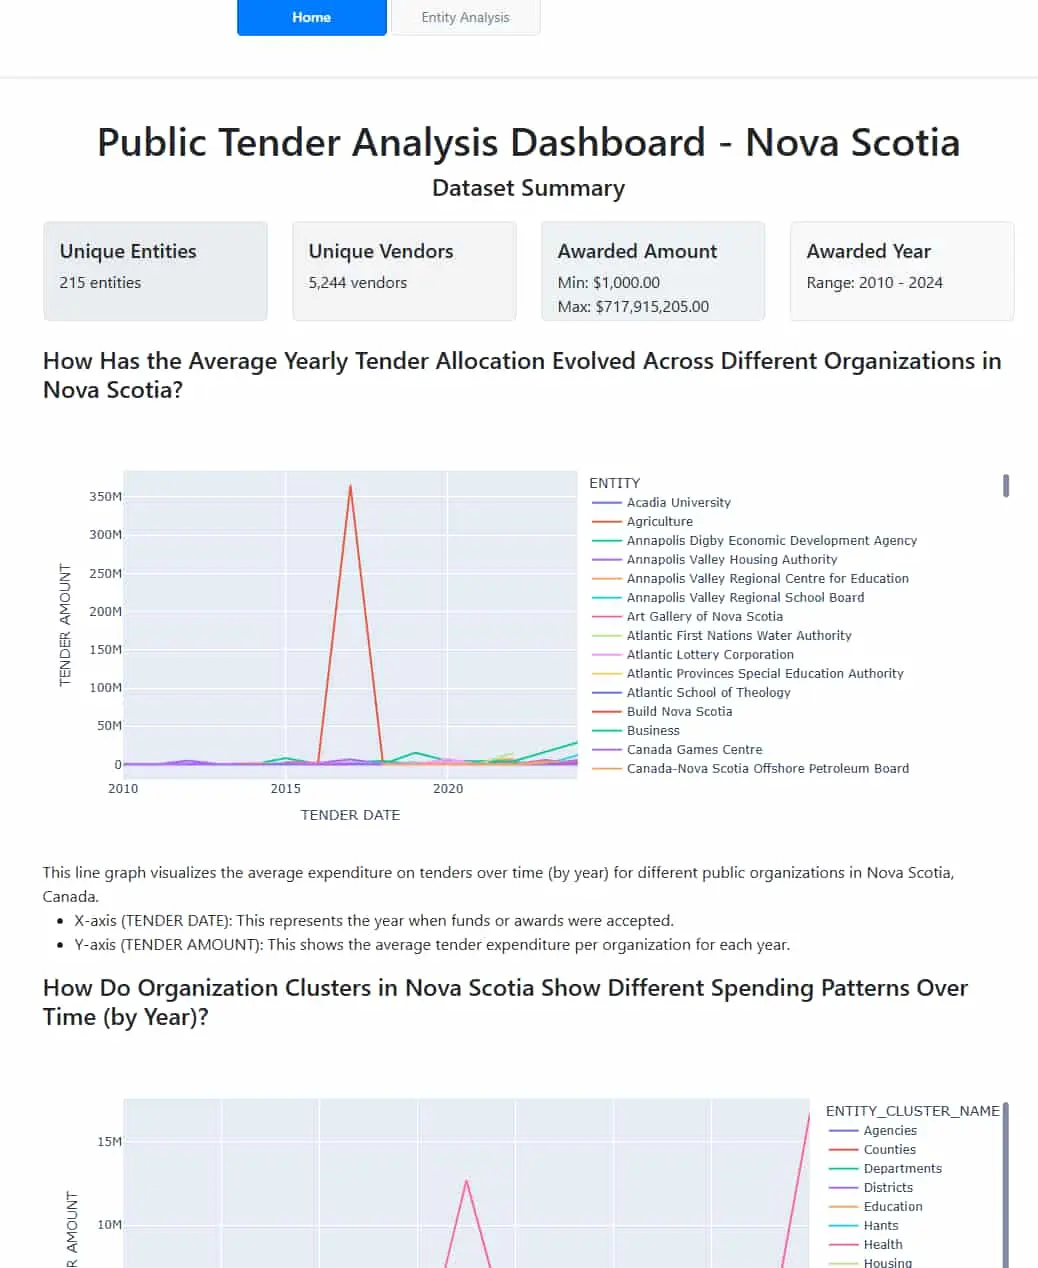
Figure: A glimpse of the interactive dashboard, bringing procurement trends to life.